The real numbers behind small online businesses
Every week we dig into real data on what small online businesses charge, earn, pay in fees and sell for, then explain what it means if you're building one. Each study comes with its data, sources and method, so you can check every number yourself.
Free, one study a week, and you can unsubscribe in one click.
From the first batch
A few numbers from the studies we just finished.
The typical online business that sold on a public marketplace was listed at about 2.4 times its yearly profit.
292 listings that sold, Jan 2025 to Oct 2026 · list pricesThe share of a $24 subscription payment you keep on plain Stripe, compared with Gumroad.
9 payment setups · fee pages, Oct 2026How much more the same 11-tool solo business software stack costs now than in 2021, while inflation was 21.8%.
Wayback Machine 2021 vs live 2026The median entry price across 104 indie SaaS pricing pages, and only 8 of 66 free trials asked for a card upfront.
104 products · pricing pages, Oct 2026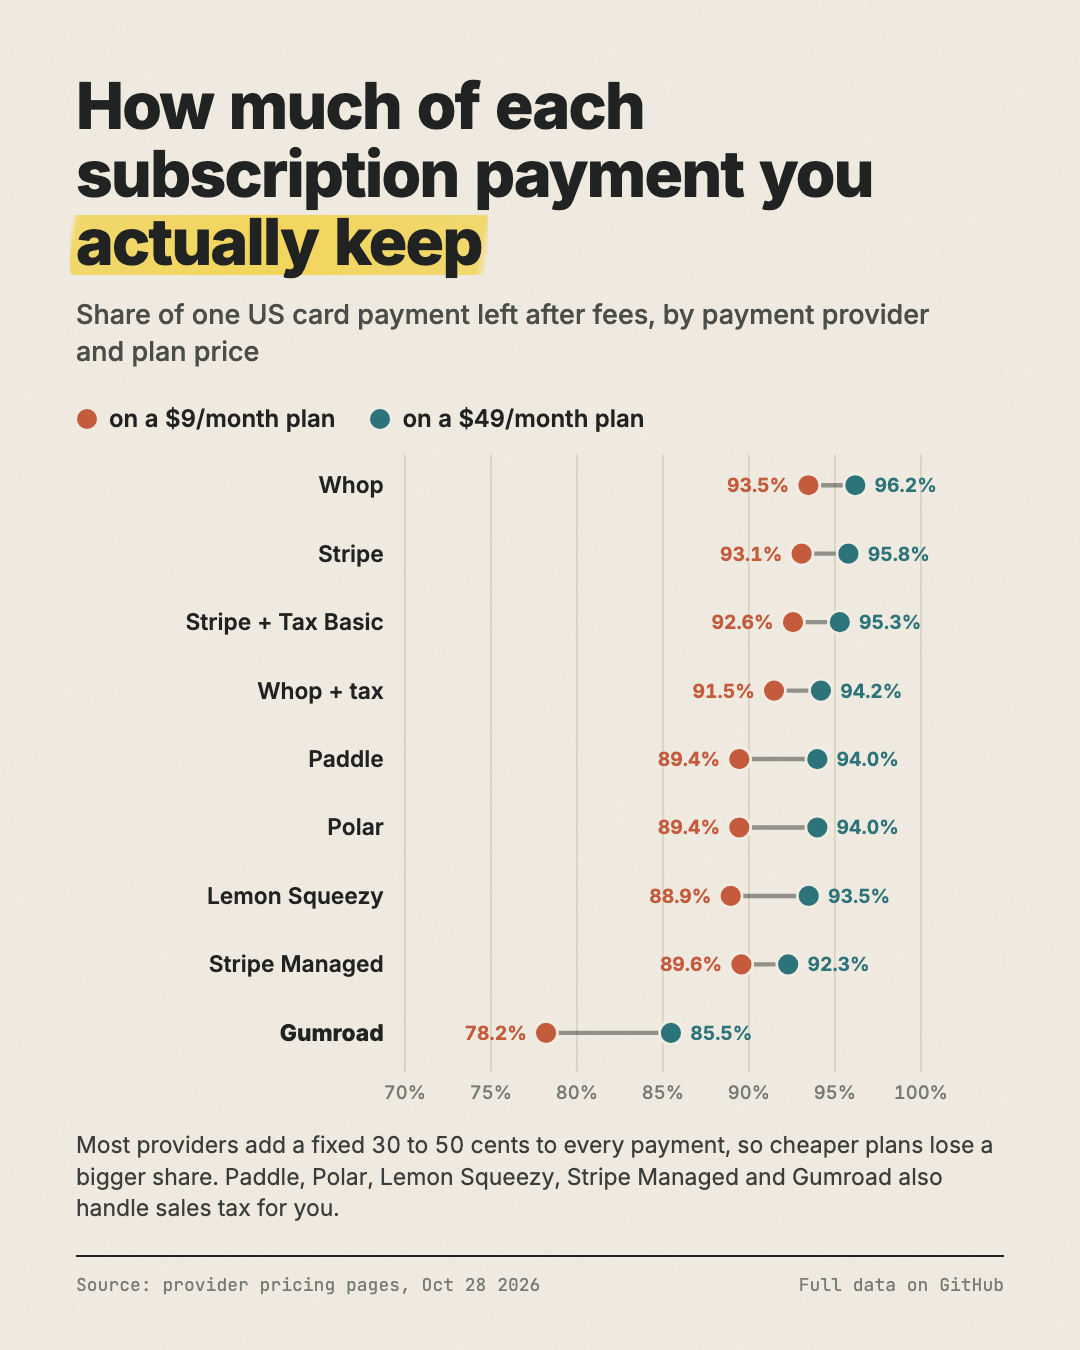
How we work
We collect public data, like pricing pages, marketplace listings and government surveys, count it ourselves, and publish the data and the scripts behind every study. When a number is self-reported, or a list price rather than a sale price, we say so right next to it, because a study is only useful if you can trust where the numbers came from.